
- ALOS-2
- Natural disaster
- Technical information
PALSAR-2
Heavy rainfall disaster associated with rainy season front
Early in July 2021, the Baiu front, which had stagnated over the southern seas of Honshu, moved north causing heavy rainfall over a wide area from western Japan to eastern Japan. From 2nd July, it became a record heavy rainfall especially in Shizuoka and Kanagawa prefectures. On 3rd July Saturday morning, , the torrential rain triggered floods and landslides and caused severe damages in various places and, especially in Izusan district of Atami city.
※The image acquired by ALOS-2 in this article are compressed for the Web display.
Intensity difference diagram derived by the satellite image
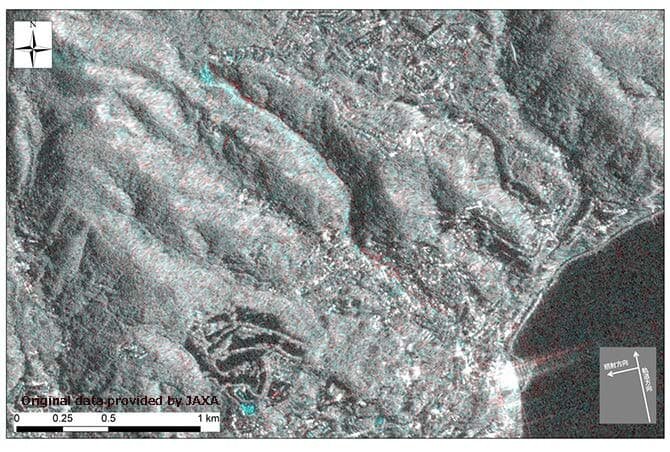
PASCO created an intesity difference map from the Synthetic Aperture Radar (SAR) image of the Advanced Land Observing Satellite-2 "ALOS-2" for the purpose of grasping a general post-disaster situation. (© JAXA)
[Before the disaster] October 11, 2020 / [After the disaster] July 4, 2021
The intensity difference diagram is a color composite SAR image in which the red color is assigned to the image before the disaster (October 11, 2020) and the blue color is assigned to the image after the disaster (4th July, 2021). We extracted the area that had changed post-disaster. The changed areas can be distinguished from the shades of red or blue color.
Intensity difference map around Izusan area, Atami city, Shizuoka prefecture
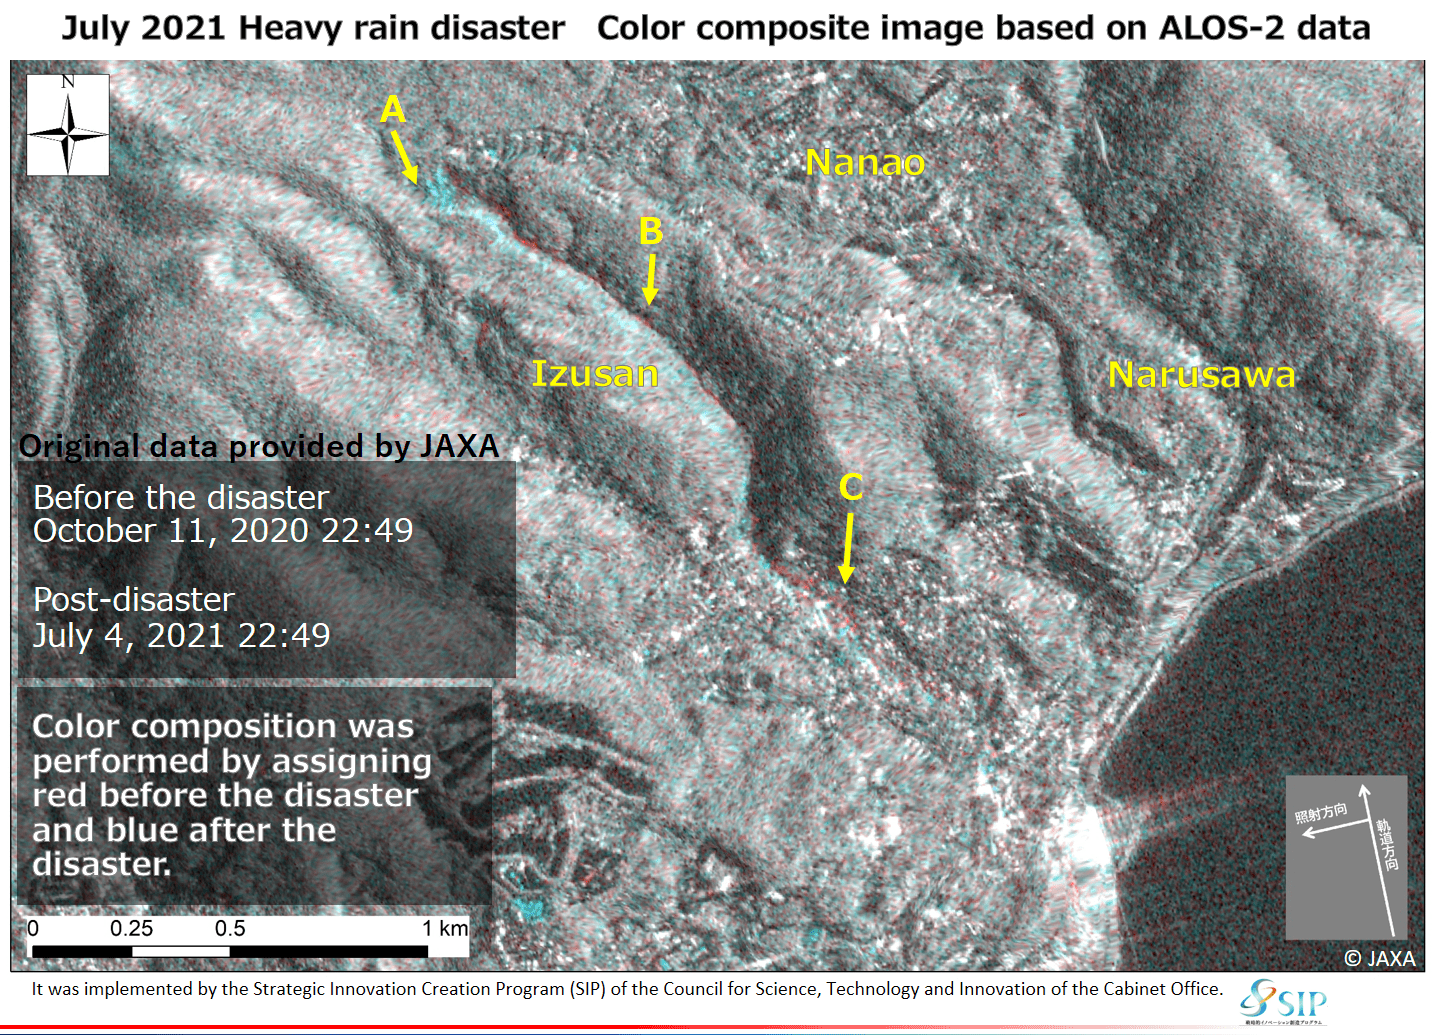
(A) The top of the valley collapsed and the terrain changed significantly as shown in blue color.
(B) The debris flow caused sediment and standing trees to flow out and the valley from landslide source to the downstream (right) is shown in red color.
(C) The places where the debris flow smashed the buildings to collapse and flow out were wider areas and shown in red and blue.
In the composite SAR image, the dense building areas generally appear as a combination of black and white dots, and when they disappear, they are represented as a combination of red and blue colors, indicating that many buildings have been washed away.
※Acquisition date and time: 22:49 (JST)
Acquisition mode: Stripmap
Polarization: HH
Acquisition orbit: Northbound orbit (left side observation)
Incident angle: 46.4 °
(The specifications are the same on both days)
* This article is based on PASCO's Disaster data acquisition Site (Japanese language only)