
- Other
- Agriculture, forestry, fishery
- Technical information
Research case studies
Examination of Water Depth Measurement Method using Optical Satellite Imagery
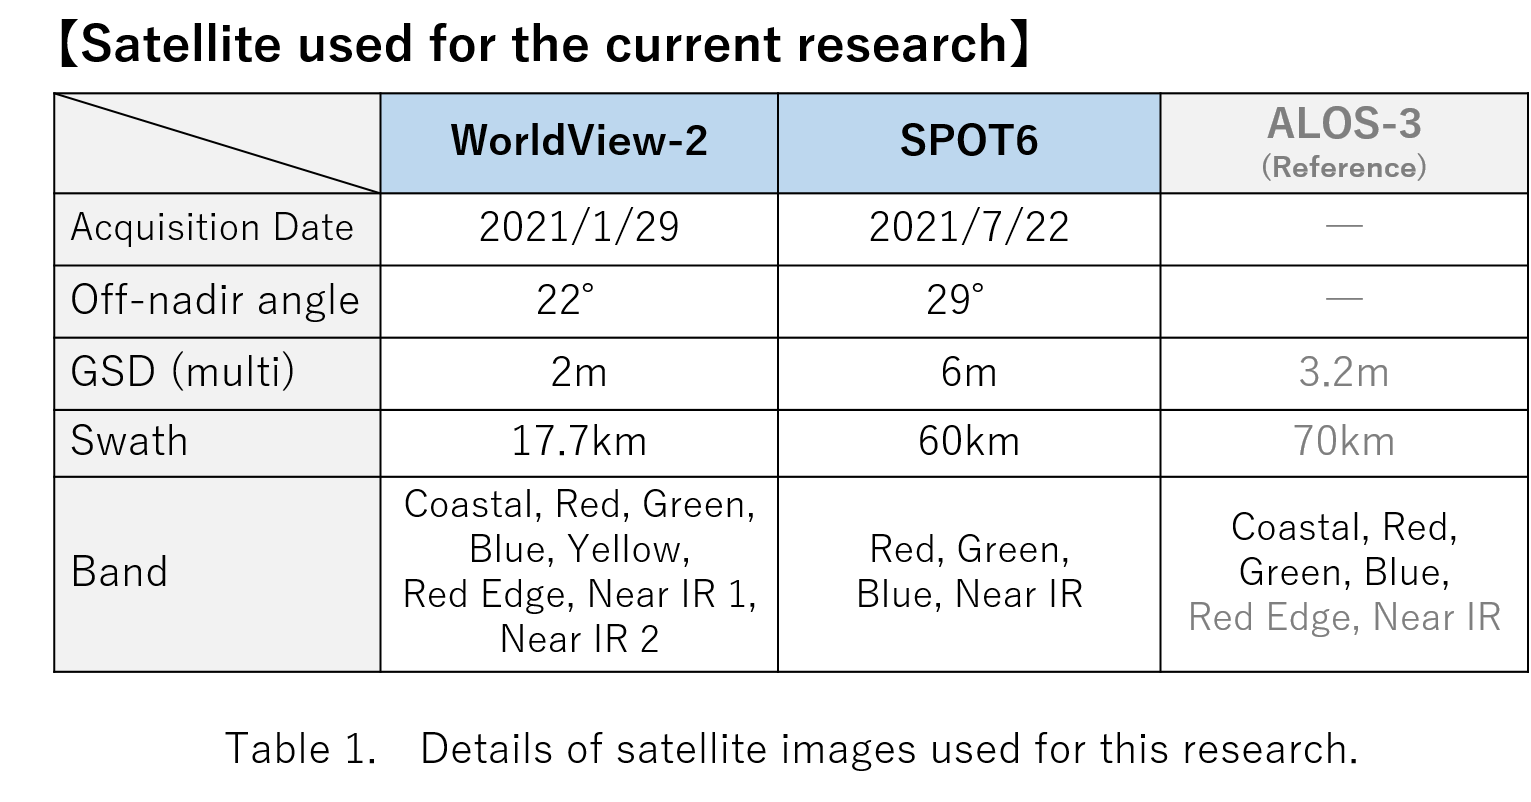
ALOS-3, an advanced optical satellite under development by JAXA, has the same Red, Green, Blue, and NIR bands as its predecessor, ALOS, and is newly equipped with Red Edge and Coastal bands. The Coastal wavelength band is less attenuated in water, so it is effective for observing coastal areas. PASCO CORPORATION is conducting research on water depth measurement methods using optical satellite images in order to study the effective use of the Coastal band. This article introduces our research.
【Objective of the Research】 The information in terms of submarine topography and littoral cover in coastal zone are useful for coastal development and environmental conservation. However, the existing water depth data does not include real fine undulations and has a rough resolution, and narrow multi-beam* sounding and aerial green LiDAR can generate more detailed terrain features with higher resolutions, although they do come at a significant cost. Therefore, in recent years, methods for estimating water depth using optical satellite images have been investigated. The purpose of the study is to reduce costs and improve workability for water depth surveys and sea bottom cover classification surveys in shallow coastal waters. It is expected to be one of the topographic survey methods in coastal shallow water areas. PASCO CORPORATION with the aim of examining the use of the Coastal band of ALOS-3, which is scheduled to be launched soon, compared the results of water depth estimation from optical satellite images and the results of narrow multi-beam sounding, and sorted out issues for practical use. *High-density topographic data can be obtained by transfiring very sharp acoustic beams from a narrow multibeam sonar onto the sea bottom in a fan shape and receiving the reflected waves from the sea bottom at separated angles of incidence. 【Research Method】 ■ Survey Method First, in July 2021, we conducted a bathymetric survey and a sea bottom cover survey in a field survey of the southeastern coastal waters of the Izu Peninsula. Next, sea bottom cover classification and water depth estimation has been performed on WorldView-2 image acquired in January and SPOT6 image acquired in July of the same year. For optical satellite images, we used image data from WorldView-2, which equips the Coastal band, and SPOT image, which is suitable for wide-area observation, assuming the use of ALOS-3 images. By comparing the two results, we verified the accuracy of the depth thrust method using optical satellite images. The details of the research are as follows. 1. Field Survey We conducted a surface survey of sea bottom topography and coverage using multi-beam bathymetry and an underwater camera. ・Field Survey Sea Area:Coast of Shimoda City, Shizuoka Prefecture (part of the analysis target sea area) ・Survey Period:July 14, 2021| 2. Optical Satellite Image Acquisition We used two types of optical satellite images of the shallow water area around the field survey area. Sea Area to be Analyzed: Coastal waters southeast of the Izu Peninsula (13.7 km2) Satellite Image used for Analysis: ① SPOT6 / Acquired on July 22, 2021 ② WorldView-2 / Acquired on January 29, 2021 ※For②, image from the time of the field survey could not be obtained. |
|
 ■ Analysis Method
The analysis method flow is as follows.
■ Analysis Method
The analysis method flow is as follows.
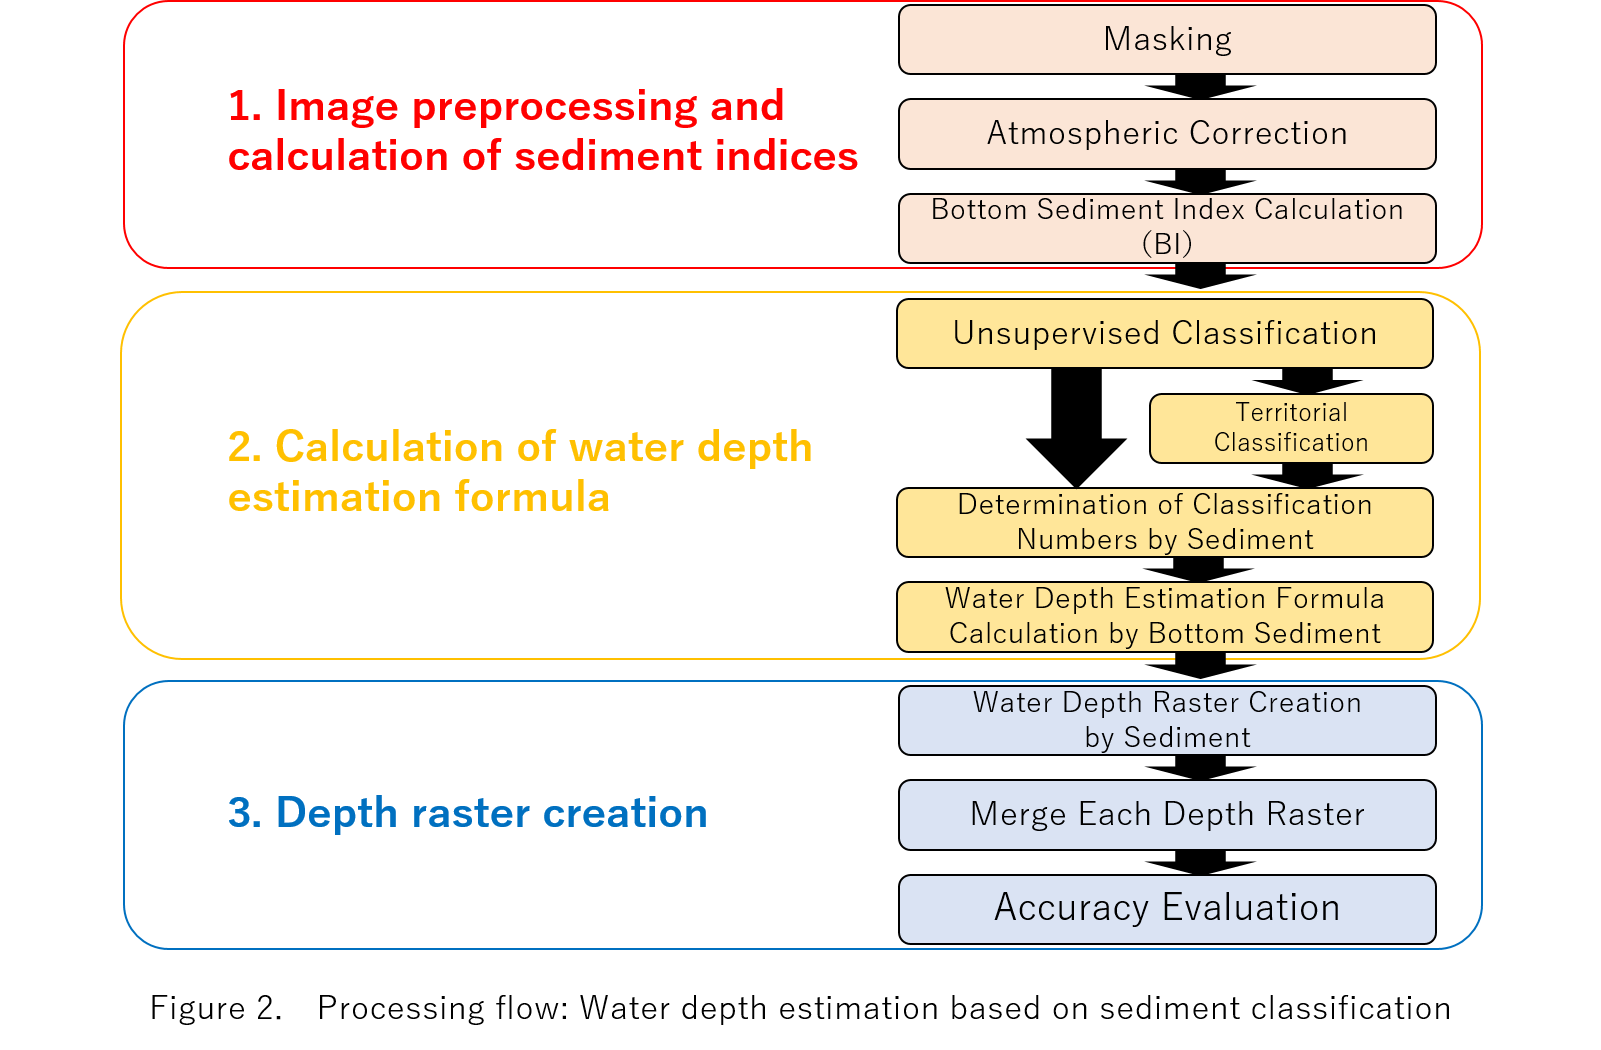 1. Image preprocessing and calculation of sediment indices
Based on the sediment index (Lyzenga D.R., 1978 and others), each pixel is classified into 3 types (sand, rock, sand/rock mixture).
2. Calculation of water depth estimation formula (Part of the field survey sea area)
Using some of the bathymetric survey results obtained in the field survey, create a water depth estimation formula from the DN value for each sediment classification classified in 1..
1. Image preprocessing and calculation of sediment indices
Based on the sediment index (Lyzenga D.R., 1978 and others), each pixel is classified into 3 types (sand, rock, sand/rock mixture).
2. Calculation of water depth estimation formula (Part of the field survey sea area)
Using some of the bathymetric survey results obtained in the field survey, create a water depth estimation formula from the DN value for each sediment classification classified in 1..3. Depth raster creation A water depth estimation image is created by each estimation formula for each classification area and integrated. After creating the water depth estimation image, we compared the water depth data (300 verification points acquired in the field survey area) that were not used in the creation of the estimation formula with the estimated water depth to evaluate the accuracy of the water depth data. In addition, accuracy of the bottom sediment classification results was evaluated by confirming classification accuracy based on underwater camera images. 【Analysis Result】 The figure below shows the accuracy verification results in the area where the field survey was conducted.
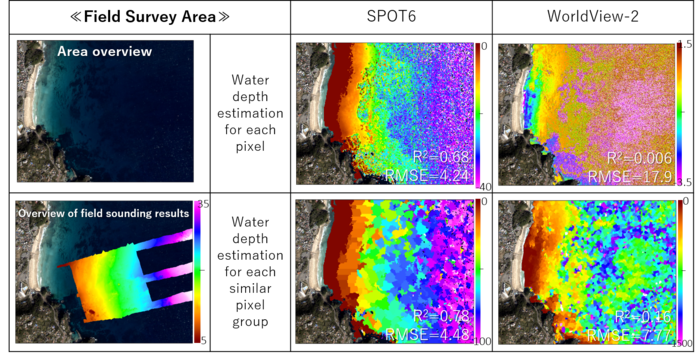
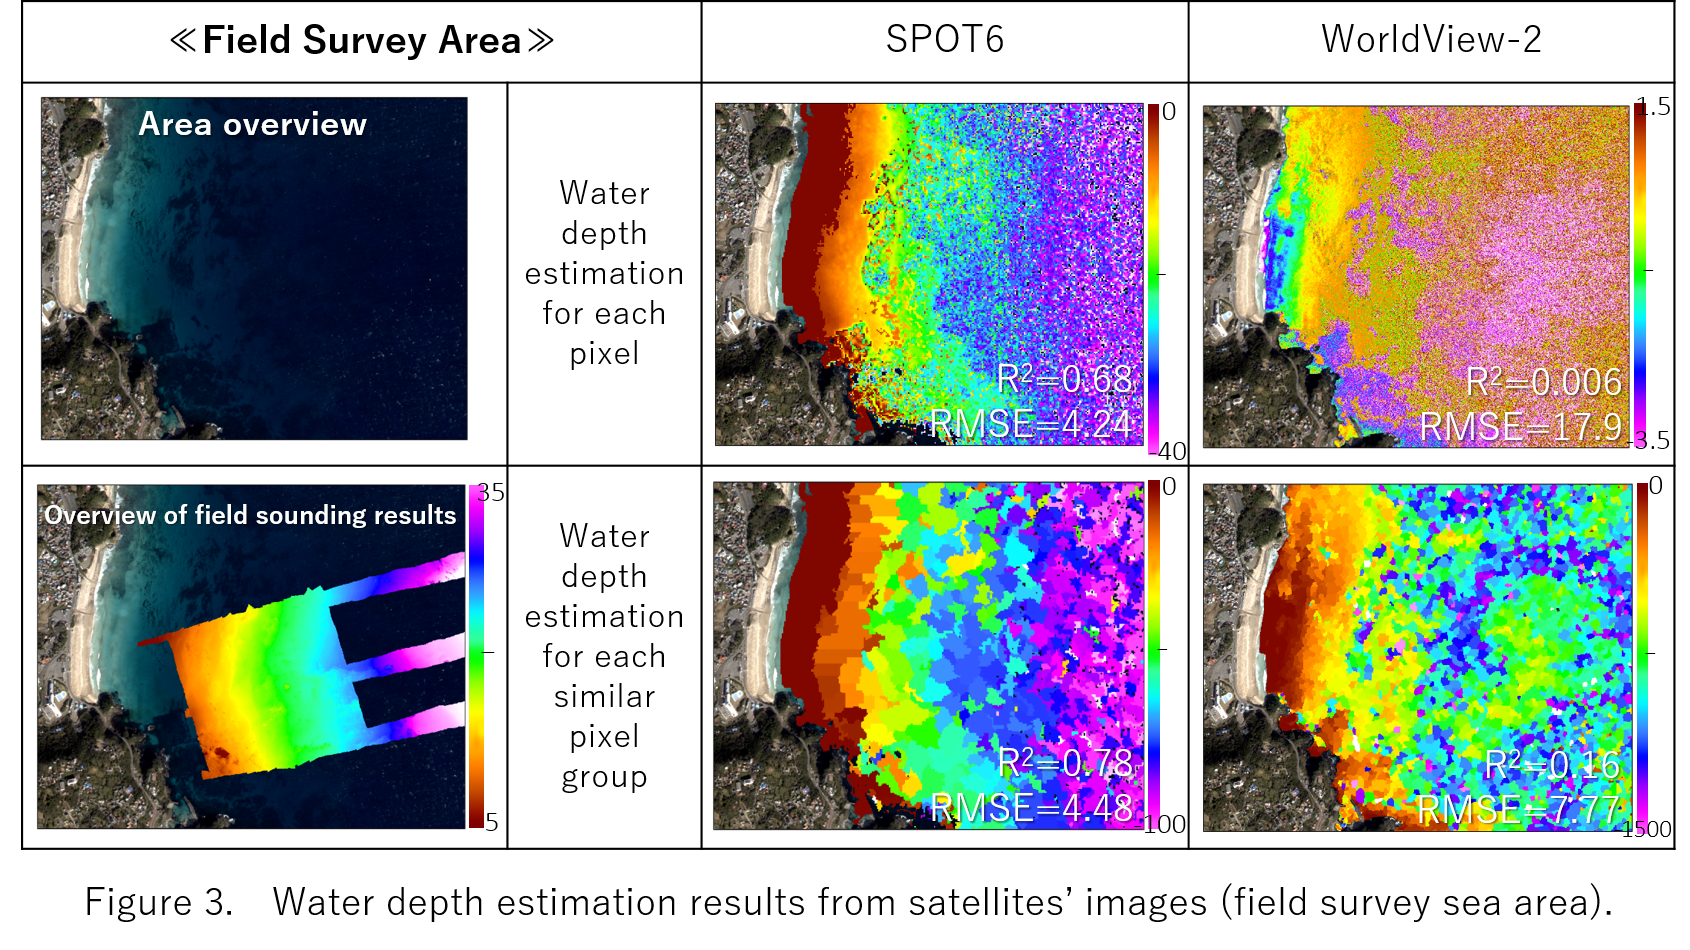 As can be seen by comparing the results of field bathymetric analysis and the analysis of optical satellite images, it was found that the SPOT6 image can relatively reproduce changes in water depth from coast to offshore. In addition, in water depth estimation for each similar pixel group, both satellite images were able to reproduce changes in water depth. This is probably due to the overall high accuracy of sediment classification.
However, in the area classified as "rock" in the WorldView-2 image acquired in winter (in January), the DN value did not decrease underwater, and the result is different from the bathymetric survey value obtained in the field survey in July. As for this image, the results show that the DN value varies greatly even among the neighboring similar pixels. In addition, after removing the whitecaps from the satellite images to reduce noise, we performed verification again. As a result, the water depth estimation accuracy was unchanged for SPOT6 image and improved for WorldView-2 image.
Since the water depth estimation formula calculated from the SPOT6 image acquired in the same summer as the field survey was highly accurate, it is speculated that one of the factors is that the observation period of the satellite image did not match. Regarding the use of ALOS-3 data, whose on-board band is similar to that of WorldView-2, it is possible to minimize errors in sediment changes due to seasons by bringing the timing of field surveys closer to the timing of satellite image observations. It is thought that this will also lead to improved estimation accuracy.
As can be seen by comparing the results of field bathymetric analysis and the analysis of optical satellite images, it was found that the SPOT6 image can relatively reproduce changes in water depth from coast to offshore. In addition, in water depth estimation for each similar pixel group, both satellite images were able to reproduce changes in water depth. This is probably due to the overall high accuracy of sediment classification.
However, in the area classified as "rock" in the WorldView-2 image acquired in winter (in January), the DN value did not decrease underwater, and the result is different from the bathymetric survey value obtained in the field survey in July. As for this image, the results show that the DN value varies greatly even among the neighboring similar pixels. In addition, after removing the whitecaps from the satellite images to reduce noise, we performed verification again. As a result, the water depth estimation accuracy was unchanged for SPOT6 image and improved for WorldView-2 image.
Since the water depth estimation formula calculated from the SPOT6 image acquired in the same summer as the field survey was highly accurate, it is speculated that one of the factors is that the observation period of the satellite image did not match. Regarding the use of ALOS-3 data, whose on-board band is similar to that of WorldView-2, it is possible to minimize errors in sediment changes due to seasons by bringing the timing of field surveys closer to the timing of satellite image observations. It is thought that this will also lead to improved estimation accuracy.